




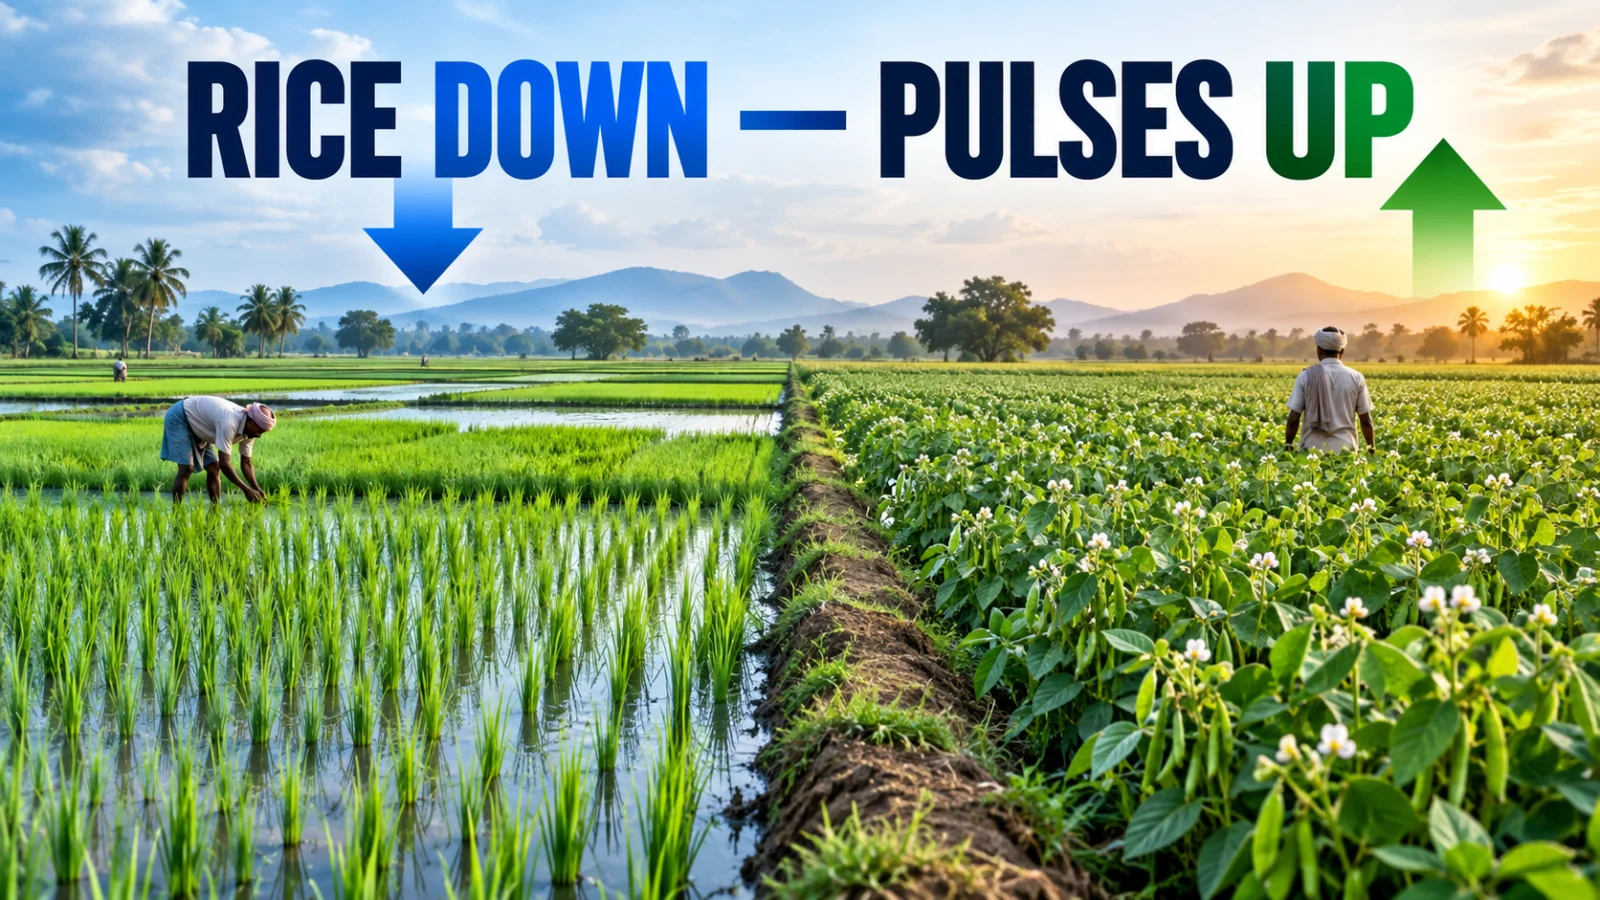
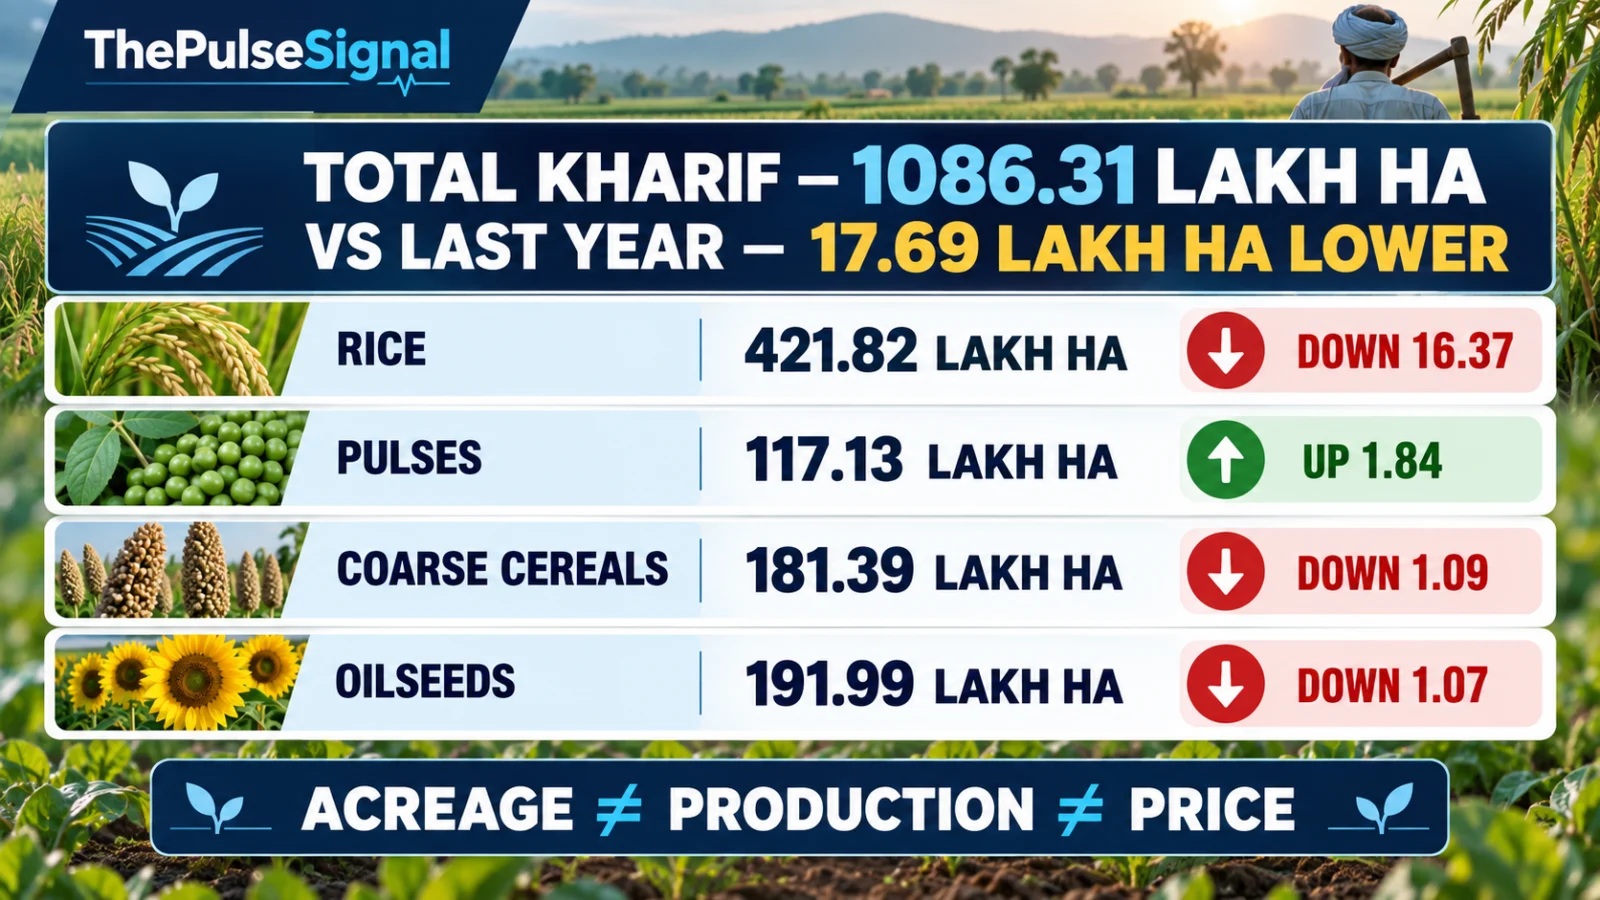
Kharif sowing 2026 reached 1086.31 lakh hectares as of September 4, but India’s total area remains 17.69 lakh hectares below the comparable level last year. The biggest reason is rice: paddy acreage is 421.82 lakh hectares, down 16.37 lakh hectares year on year. Pulses are moving in the opposite direction, with total area at 117.13 lakh hectares, 1.84 lakh hectares above last year.
Current answer: India’s kharif sowing is still below last year’s comparable level even though total acreage has continued to increase week by week. Rice accounts for most of the national acreage gap, while pulses are above last year. These figures describe area sown only; they do not by themselves prove lower production, lower yield, crop shortage or higher market prices.
Kharif sowing 2026: what is the latest total area?
The Ministry of Agriculture’s progressive crop-area data show total kharif coverage at 1086.31 lakh hectares as of September 4, 2026. The comparable 2025-26 figure was 1104.00 lakh hectares, leaving the current season 17.69 lakh hectares lower.
The national total has still moved higher from the previous weekly report as sowing progressed. On August 28, total kharif coverage stood at 1071.10 lakh hectares. The important distinction is therefore that 2026 acreage is still increasing week to week while remaining below last year’s comparable level.
Which crops are ahead or behind last year?
| Crop | 2026-27 area | 2025-26 comparable area | Year-on-year difference |
|---|---|---|---|
| Total kharif | 1086.31 lakh ha | 1104.00 lakh ha | -17.69 lakh ha |
| Rice | 421.82 lakh ha | 438.19 lakh ha | -16.37 lakh ha |
| Pulses | 117.13 lakh ha | 115.30 lakh ha | +1.84 lakh ha |
| Coarse cereals | 181.39 lakh ha | 182.48 lakh ha | -1.09 lakh ha |
| Oilseeds | 191.99 lakh ha | 193.06 lakh ha | -1.07 lakh ha |
| Sugarcane | 58.47 lakh ha | 58.87 lakh ha | -0.40 lakh ha |
| Jute & Mesta | 6.34 lakh ha | 6.24 lakh ha | +0.10 lakh ha |
| Cotton | 109.17 lakh ha | 109.87 lakh ha | -0.69 lakh ha |
Why is total kharif acreage still below last year?
Rice is the dominant reason. Paddy area is 16.37 lakh hectares below the comparable level last year, which accounts for most of the total 17.69-lakh-hectare national deficit.
The Ministry’s state-wise breakdown identifies sizeable negative rice-area contributions from states including Karnataka, Telangana, Uttar Pradesh, Andhra Pradesh, Madhya Pradesh, Tamil Nadu, Jharkhand and Maharashtra.
That does not mean every rice-growing district is behind or that final rice production will fall by the same proportion. Acreage is only one part of the production equation.
Which crops are gaining area?
Total pulses are ahead of last year by 1.84 lakh hectares. Within crop sub-groups, the September 4 data show notable gains including:
- Urad: +2.68 lakh hectares;
- Bajra: +1.99 lakh hectares;
- Sesamum: +1.44 lakh hectares;
- Tur: +0.72 lakh hectares.
Jute and Mesta are also slightly above last year’s comparable area.
Which crops are still lagging?
Several important crop groups remain below last year even though total kharif sowing continues to progress. Current negative differences include:
- Maize: -2.99 lakh hectares;
- Castorseed: -1.23 lakh hectares;
- Soybean: -1.16 lakh hectares;
- Ragi: -1.17 lakh hectares;
- Oilseeds overall: -1.07 lakh hectares;
- Coarse cereals overall: -1.09 lakh hectares;
- Cotton: -0.69 lakh hectares.
If you are checking current sowing progress: use the September 4 crop-area table as the current official acreage state.
If you are trying to estimate production: acreage alone is not enough. Yield, rainfall, crop condition, pest pressure and later official production estimates still matter.
If you are trying to predict prices: this acreage report alone does not establish future mandi or retail price direction.
Does lower rice acreage mean lower rice production?
Not automatically. Area sown is one input into crop output. Final production also depends on yield, crop health, rainfall distribution, irrigation, weather during later growth stages and other agronomic conditions.
The September 4 acreage report therefore supports a statement that less rice area has been reported than at the comparable point last year. It does not by itself support a final rice-production forecast.
Does the acreage gap mean crop prices will rise?
No price direction is established by this report alone. Commodity prices can depend on expected production, stocks, imports and exports, procurement, demand, weather, global markets and government policy in addition to sowing area.
TPS should therefore keep acreage, production and price conclusions separate unless later evidence connects them.
How did the picture change from the previous week?
Total kharif acreage rose from 1071.10 lakh hectares on August 28 to 1086.31 lakh hectares on September 4 as sowing progressed. Rice also increased in absolute area during the week, but its year-on-year gap remained the largest among major crop groups.
This is why the maintained seasonal view matters: a larger weekly total does not automatically mean the year-on-year deficit has disappeared.
What happens next?
The next useful state is the next official weekly crop-area report. TPS should update this same URL with the new total, crop-level changes, week-over-week movement and any material state-level divergence.
As the sowing season stabilises, official production estimates will become increasingly important and may eventually supersede acreage as the main current-answer surface for crop-supply questions.
What remains unresolved?
- Final 2026 kharif acreage.
- Final crop yields.
- Final kharif production.
- Procurement volumes.
- Any crop-specific price effect.
- Later weather effects on crop condition.
- Whether current acreage gaps persist through the end of the sowing season.
Verification note: ThePulseSignal reviewed the Ministry of Agriculture’s September 4 progressive crop-area table and reconciled it with the previous August 28 weekly state to separate current acreage, year-on-year differences and week-over-week progress. Acreage was kept distinct from later production, yield and price outcomes.