






ASUSE 2025 district data gives readers a new way to compare India’s unincorporated non-agricultural economy below the State and Union Territory level. The National Statistics Office has released district-level estimates covering 757 of the 770 districts in the ASUSE 2025 sampling frame, with indicators on establishments, workers, ownership and employment structure, women’s participation, registration, emoluments and productivity.
The important word is estimates. ASUSE is a sample survey, not an administrative census of every business. The new district tables can reveal meaningful differences in business scale, employment and productivity, but they should not be read as a simple league table of the “best” or “worst” districts.
Coverage: 757 of 770 districts in the ASUSE 2025 sampling frame.
Sector: Unincorporated non-agricultural establishments in manufacturing, trade and other services.
Main measures: Establishments, workers, women’s participation, registration, emoluments and GVA-based productivity.
Key caution: District geography and statistical precision can differ, so rankings require context.
What ASUSE 2025 district data actually measures
The Annual Survey of Unincorporated Sector Enterprises, or ASUSE, measures economic activity among unincorporated non-agricultural establishments. In practical terms, this captures a large part of the small-enterprise economy operating outside incorporated-company structures.
The district-level release makes it possible to compare several different dimensions that were previously easier to examine mainly at national or State and Union Territory level.
| Indicator | What it helps show | What it does not prove by itself |
|---|---|---|
| Estimated establishments | Scale of unincorporated business activity | Productivity, profitability or business quality |
| Estimated workers | Employment supported by surveyed establishments | Worker income quality or labour productivity by itself |
| Women’s participation | Gender composition in ownership or employment indicators | Equal wages, business control or economic outcomes without further evidence |
| Registration status | Surveyed registration characteristics of establishments | Full legal or tax compliance across every enterprise |
| GVA per establishment | Average value added relative to establishment count | Total district economic size |
| GVA per worker | Average labour-productivity indicator | Worker wages or household income |
Why the 757-district coverage matters
This is the first time NSO has disseminated district-level estimates from a large-scale nationwide survey in this form. That creates a much more granular evidence layer for researchers, planners, journalists and business readers who previously had to rely more heavily on broader State or national aggregates.
The official release says ASUSE 2025 district estimates cover 757 of the 770 districts in the survey sampling frame. That number should not be confused with a simple count of every district on today’s administrative map.
District boundaries and names used in the survey can differ from the latest administrative configuration. A district comparison therefore needs to follow the geography used by the ASUSE sampling design rather than assuming every row maps perfectly to the newest district boundaries.
What the concentration figures show
One of the most useful findings is the concentration of establishments, workers and gross value added across districts.
According to the official release, the top 10 districts collectively account for roughly one-tenth of estimated establishments, workers and GVA in the covered unincorporated non-agricultural sector. Expanding the comparison to the top 50 districts raises that collective share to nearly one-third.
The release also says roughly one-third of covered districts have more than one lakh estimated establishments, while 16 districts exceed five lakh establishments.
Those numbers show that local enterprise activity is unevenly distributed. They do not establish that the largest districts are also the most productive, most formalised or best locations for starting a business.
Scale and productivity are not the same thing
A district can rank highly by number of establishments but rank differently by GVA per establishment or GVA per worker.
This distinction is important because each metric answers a different question:
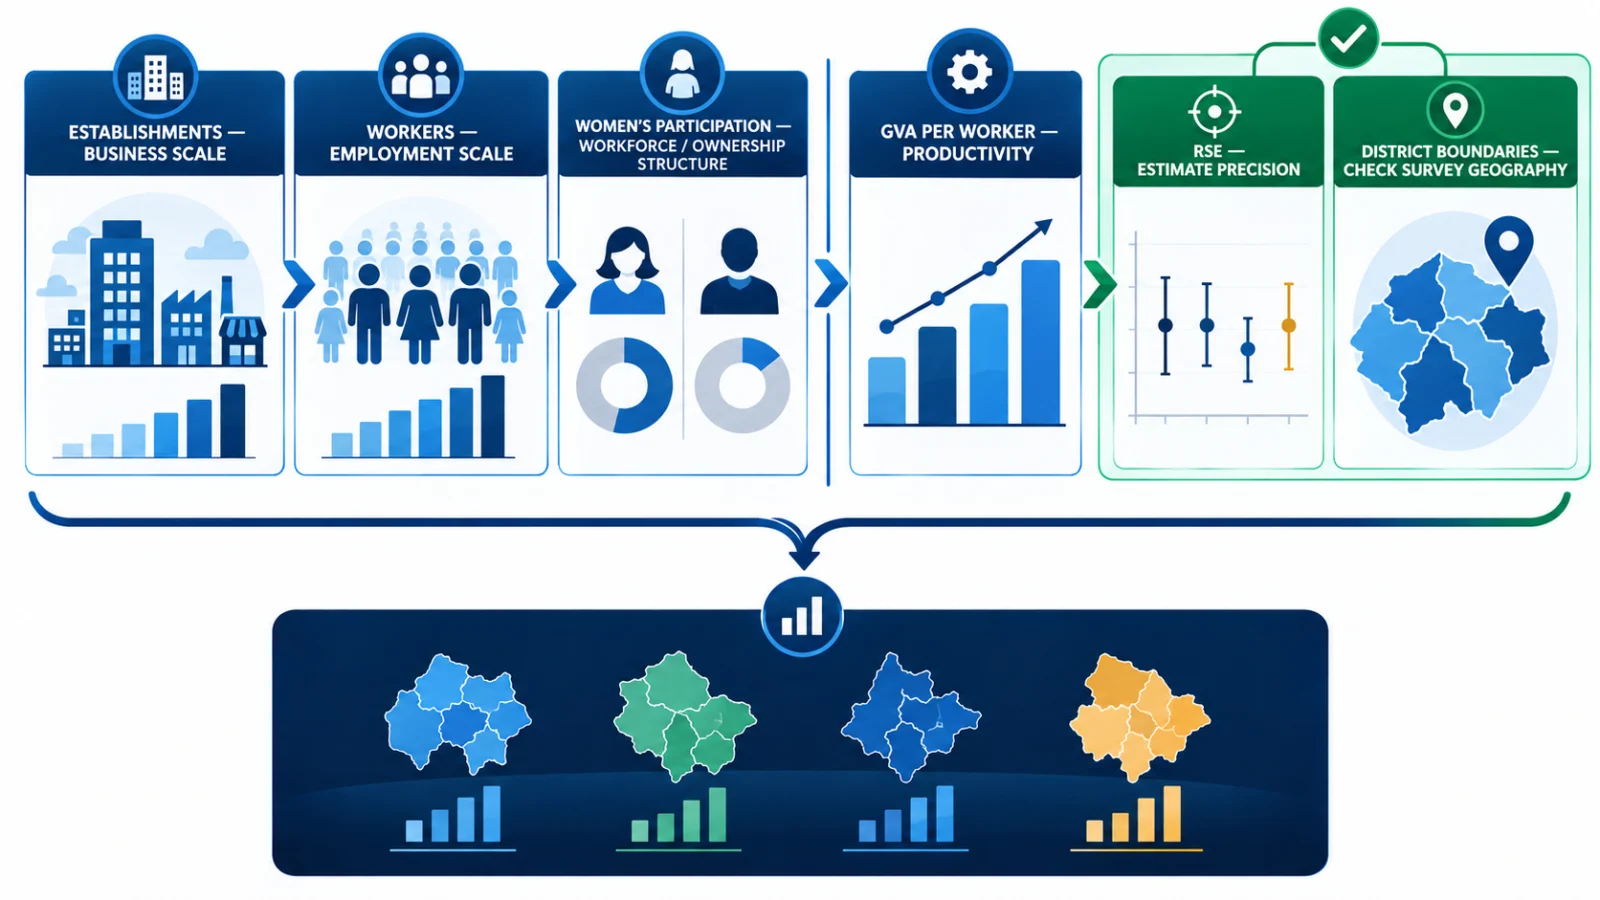
- Establishments describe estimated business scale.
- Workers describe estimated employment scale.
- GVA per establishment indicates average value added relative to business count.
- GVA per worker provides a labour-productivity measure.
A high-establishment district can therefore be economically important because of sheer scale while still having a different productivity profile from a smaller district with higher value added per worker.
How to read women’s participation correctly
The district release also creates a new way to examine women’s participation within the unincorporated non-agricultural sector.
That can support questions about where women are more visible in enterprise ownership or employment, but the indicator should not be expanded beyond what the survey measures. A high participation rate does not automatically prove equal earnings, equal business ownership quality, access to finance or better working conditions.
Those are separate research questions requiring additional evidence.
Registration status is useful, but it is not a complete formalisation score
ASUSE includes registration-related indicators that can help readers compare characteristics of establishments across districts.
But “registered” should not be treated as one universal measure of formalisation. Different registrations can reflect different legal, tax, local or sectoral requirements. The ASUSE tables are useful for describing the registration characteristics captured by the survey, not for declaring that one district is fully formal and another is not.
Why Delhi district estimates are unavailable
Delhi requires a specific caveat.
The official methodology notes that Delhi districts were combined into broader strata for sampling purposes, so separate district-level estimates could not be produced in the same way as for the other covered districts.
That means readers should not interpret the absence of Delhi district rows as zero activity or missing businesses. It is a survey-design limitation, not an economic conclusion.
ASUSE estimates are not census counts
ASUSE is based on a scientifically designed sample survey. Its district figures are estimates derived from that sample.
This matters because estimates have sampling uncertainty. NSO provides relative standard error, or RSE, information to help users judge statistical precision. Some district estimates can carry higher RSEs than others.
A difference between two district estimates should therefore not automatically be interpreted as a meaningful economic gap if the underlying estimates are imprecise.
How to compare two districts responsibly
| Check | Why it matters |
|---|---|
| Use the same indicator | Do not compare one district’s establishment count with another district’s productivity measure. |
| Check survey geography | The district definition used by ASUSE may not match the latest administrative map. |
| Check estimate precision | RSE can affect how confidently differences should be interpreted. |
| Separate scale from productivity | More establishments or workers does not necessarily mean greater output per worker or establishment. |
| Avoid causal conclusions | The tables describe estimated economic patterns; they do not by themselves explain why a district performs differently. |
What this dataset can be used for
The district-level ASUSE release can support several legitimate uses:
- local business and employment research;
- district and State planning;
- journalistic comparisons of unincorporated-sector structure;
- research into women’s participation and ownership patterns;
- analysis of registration characteristics;
- comparisons of GVA-based productivity; and
- identifying districts that warrant deeper investigation using other datasets.
It should not be used alone to make investment, lending, tax, regulatory or business-location decisions. Those decisions require additional current evidence.
What ASUSE 2025 district data does not tell us
The new district release does not provide a complete census of all businesses, does not measure the incorporated corporate sector, and does not automatically establish household prosperity, wages, profitability or investment attractiveness.
It also does not establish causation. If one district has a higher GVA-per-worker estimate than another, the ASUSE table alone does not prove which policy, industry structure, workforce characteristic or local condition produced that difference.
Bottom line
ASUSE 2025 district data is most valuable as a new local economic evidence layer, not as a simple ranking table. It lets readers compare estimated business scale, employment, women’s participation, registration and productivity across 757 districts in the survey sampling frame.
The strongest interpretation comes from comparing like-for-like indicators while respecting sampling uncertainty, district-boundary differences and the fact that the estimates are not census counts.
Used carefully, the dataset can help researchers and readers see how India’s unincorporated non-agricultural economy varies locally in a way that earlier broader ASUSE releases could not.
Verification note
ThePulseSignal reviewed the official PIB/MoSPI release announcing the district-level ASUSE 2025 estimates and the NSO ASUSE microdata and methodology material used to understand coverage, indicator scope and survey limitations.
Limitations and unresolved facts
- Estimate-level RSEs were not exhaustively reviewed for every district in this article.
- District names and boundaries used by ASUSE may differ from current administrative geography.
- Delhi does not have comparable district-level estimates because districts were combined into sampling strata.
- The future cadence of district-level ASUSE dissemination has not been established here.
- Future revised tables, methodology changes or corrections could change individual district estimates.