






The SEBI F&O retail trader losses 2026 data show a derivatives market that became smaller in FY26 but remained extremely difficult for individual traders to navigate profitably. SEBI’s latest studies found lower participation and lower aggregate individual losses, yet 87.7% of individuals covered by the profitability study still incurred net losses.
The important question is therefore not simply whether the total loss number fell. It is what changed after tighter derivatives-market measures, why losses remain concentrated among options and frequent traders, and whether individuals who continued trading actually became more profitable.
Important: SEBI released a profitability study and a separate trading-behaviour study. The studies use different datasets and trader counts. The 87.5 lakh active-trader figure from the behavioural study should not be treated as the exact population behind every profitability statistic.
What does the SEBI F&O retail trader losses 2026 study show?
SEBI published two related equity-derivatives studies on August 20, 2026 covering FY25 and FY26.
The profitability study examined the trading profits and losses of individuals in the equity-derivatives segment. The separate behavioural study examined participation, trading frequency, product preference, persistence and characteristics of individual traders.
Taken together, the studies point to four major developments:
- individual F&O participation declined in FY26;
- aggregate individual net losses declined;
- the percentage of individuals losing money remained extremely high;
- options and high-frequency participation continued to account for a disproportionate share of losses.
How many individual F&O traders lost money in FY26?
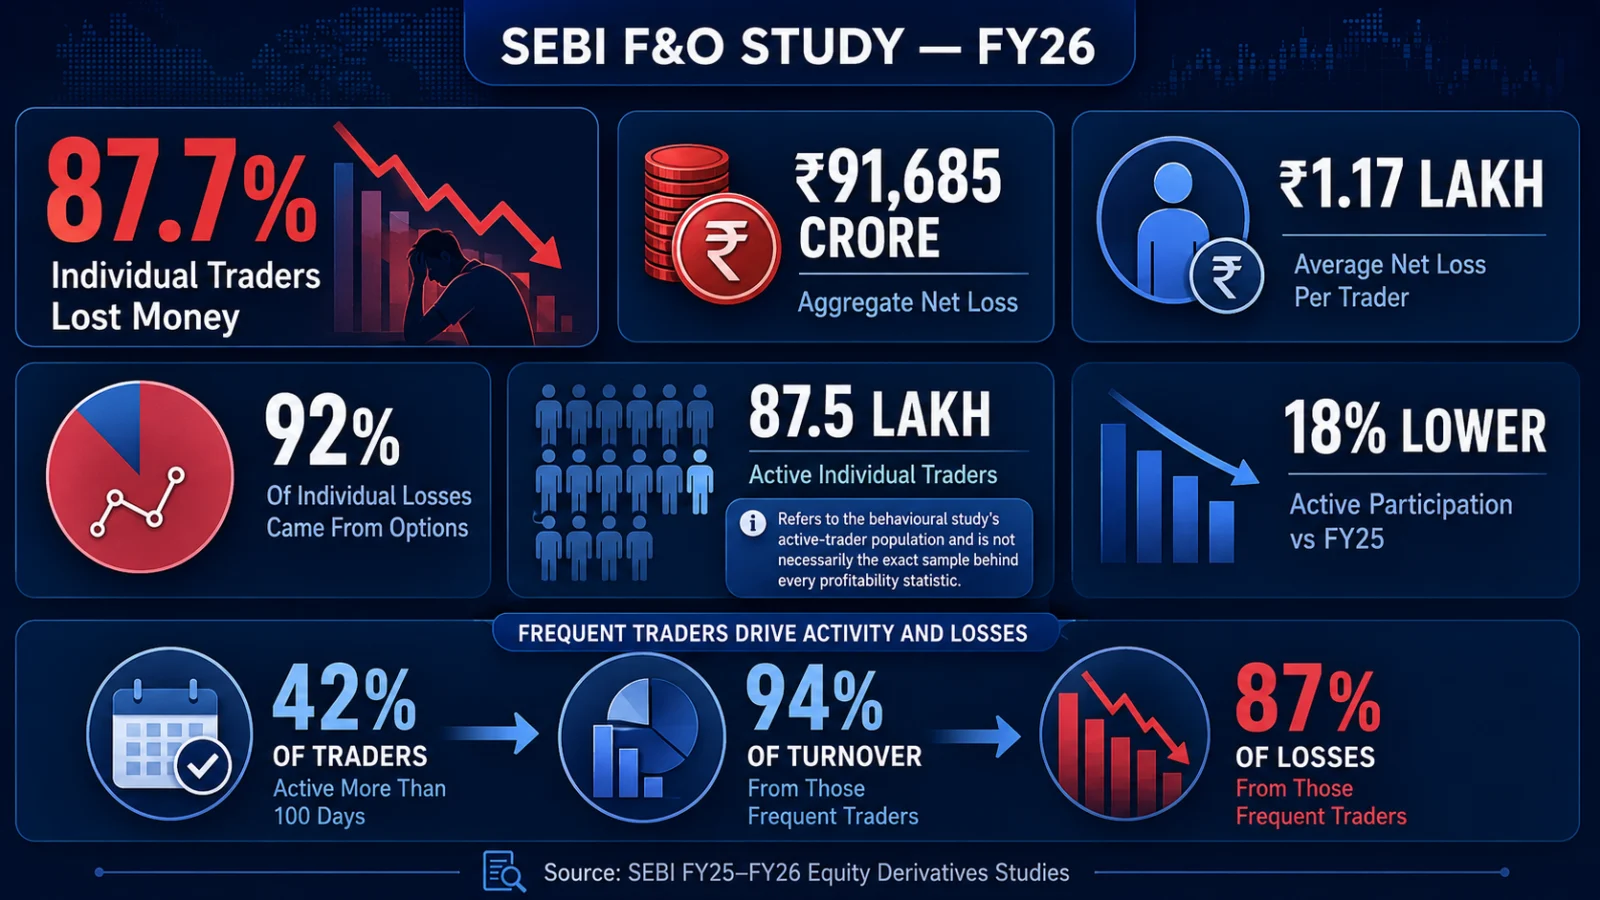
SEBI’s profitability study found that 87.7% of individual traders in its FY26 sample incurred net losses.
That was an improvement from 90.9% in FY25, but the basic profitability problem remained: close to nine out of every ten individuals covered by the study lost money.
The 87.7% figure does not mean that 87.7% of all Indian investors lost money. It applies specifically to individual traders covered by SEBI’s equity-derivatives profitability study.
How much did individual F&O traders lose?
Aggregate net losses among individuals in the profitability analysis were approximately ₹91,685 crore in FY26, down from about ₹1.12 lakh crore in FY25.
That represents a substantial decline in total losses.
But the aggregate number does not tell the full story. The average net loss per trader increased to approximately ₹1.17 lakh in FY26, compared with roughly ₹1.14 lakh in FY25.
So while fewer individuals participated and aggregate losses declined, the individuals who remained active did not suddenly become broadly profitable.
Did SEBI’s tighter F&O rules work?
The data support a more nuanced conclusion than either saying the reforms succeeded completely or failed.
SEBI’s behavioural study reported that active individual traders fell approximately 18%, from 106.2 lakh in FY25 to 87.5 lakh in FY26.
Aggregate individual net losses also fell by approximately 18% in the profitability study.
However, the proportion of individuals losing money improved only modestly, while average losses per trader increased.
SEBI’s post-2024 derivatives measures coincided with lower individual participation and lower aggregate losses, but FY26 data do not show that the typical individual who remained active became profitable.
The studies should not be used to claim that regulation alone caused every change. Market conditions, accumulated losses, trading costs, altered contract economics and individual behaviour can also influence participation.
Why options dominate retail F&O losses
The SEBI F&O retail trader losses 2026 findings show that the individual-loss problem is overwhelmingly concentrated in options.
SEBI’s profitability findings indicate that options generated about 92% of aggregate individual losses.
About 99.3% of individual derivatives traders traded options at least once, while approximately 93% traded only options.
The loss incidence among options traders was approximately 87.7%, compared with a lower loss incidence among futures traders.
This does not mean futures are safe or that every options strategy loses money. It shows that options accounted for the overwhelming majority of individual activity and aggregate loss exposure in the study.
Frequent traders accounted for most turnover and losses
The behavioural study also shows how strongly losses were concentrated among highly active participants.
Individuals active for more than 100 trading days represented about 42% of traders in the relevant analysis.
But this group accounted for approximately:
- 94% of turnover; and
- 87% of losses.
The average loss among these frequent traders was also substantially larger than among individuals active on fewer trading days.
This means trading intensity matters considerably when interpreting the headline F&O loss rate.
A smaller group generated most aggregate losses
SEBI’s findings also show that losses were not distributed evenly across all individual traders.
Approximately 23% of traders accounted for nearly 90% of aggregate individual losses.
This is important because the ₹91,685 crore headline should not be interpreted as though every trader lost similar amounts.
Occasional participants, low-turnover traders and extremely active traders had materially different exposure profiles.
What happened to individual participation?
SEBI’s behavioural study reported a significant reversal in participation during FY26.
The number of active individual traders declined from 106.2 lakh in FY25 to 87.5 lakh in FY26.
The study also showed weaker new participation and substantial churn among people who had traded in the previous year.
The data establish that the retail derivatives market changed materially in FY26. They do not, however, establish a single cause for every trader’s decision to exit.
Does more F&O trading experience lead to profitability?
The multi-year cohort data provide little support for the assumption that simply remaining active for more years causes the typical trader to become consistently profitable.
Among one cohort continuously active over five years, approximately 65.6% lost money in every year, while only around 0.5% were profitable in every year.
This does not mean an individual trader cannot improve. It means continued participation did not translate into broad, consistent profitability across the cohort studied.
Why portfolio size and derivatives turnover matter
SEBI’s behavioural findings also highlight the relationship between traders’ underlying equity portfolios and the scale of their derivatives activity.
Some individuals with relatively small equity portfolios generated derivatives turnover many times larger than the value of their underlying holdings.
Turnover is not identical to capital at risk. But extremely high turnover relative to a trader’s financial base can indicate intensive use of leveraged instruments and repeated exposure to short-term market movements.
The practical risk question is therefore not merely whether someone trades derivatives, but how large and how frequently that person trades relative to available capital.
What does the study show about younger traders?
Individuals under 30 represented a large share of derivatives participation.
SEBI’s findings indicate that approximately 88.5% of traders under 30 lost money.
Younger traders also showed much higher derivatives turnover relative to their equity portfolios than older groups.
Age alone should not be treated as the cause of losses. Product selection, trading frequency, leverage, risk management and capital exposure also matter.
What about lower-income traders?
SEBI’s analysis found that individuals reporting annual income below ₹5 lakh represented a substantial share of derivatives participants and contributed materially to aggregate losses.
This makes the findings relevant beyond market-volume statistics because similar absolute losses can have very different consequences depending on an individual’s financial buffer.
Reported income, however, is not a complete measure of household wealth or risk capacity.
Are losses concentrated only in major financial centres?
No. The behavioural study shows that individuals outside India’s top 30 cities represented a majority of active derivatives traders and accounted for more than half of individual losses.
Retail derivatives participation is therefore geographically broad and is not limited to India’s largest financial centres.
What did institutional traders earn?
SEBI’s findings show very different aggregate outcomes for some institutional participant categories.
Proprietary traders and foreign portfolio investors recorded substantial gross trading profits, and algorithmic trading represented a large share of institutional profitability.
But those figures should not be presented as proof that every rupee lost by an individual trader was directly transferred to an institutional counterparty.
Derivatives markets involve multiple participant categories, hedges, transaction costs and offsetting positions. The studies establish contrasting aggregate outcomes, not a simple one-to-one transfer.
Why short-duration options still matter
Short-dated index options remain an important part of derivatives activity.
The behavioural analysis found that a large proportion of index-option turnover was concentrated in contracts close to expiry.
That matters because short-duration options can change value rapidly as expiry approaches, especially when the underlying index moves and time value decays.
SEBI’s derivatives interventions have therefore targeted areas including weekly expiries, minimum contract sizes, upfront option-premium collection, expiry-day risk and position monitoring.
What F&O measures had SEBI introduced?
The FY26 study period came after several derivatives-market measures beginning in late 2024 and continuing afterward.
These included changes relating to:
- weekly index-derivative expiries;
- minimum derivative contract sizes;
- upfront collection of option premiums;
- additional expiry-day risk coverage;
- calendar-spread margin treatment on expiry;
- intraday monitoring of position limits; and
- standardisation and rationalisation of derivative expiries.
The wider regulatory objective is investor protection and market-risk control while preserving legitimate derivatives use for hedging and price discovery.
SEBI has also strengthened investor-information controls in other areas. ThePulseSignal’s SEBI PaRRVA explainer explains how verified risk-and-return claims are intended to work for regulated entities.
Does the FY26 study prove SEBI’s reforms failed?
No.
The decline in participation and aggregate individual losses is meaningful.
At the same time, an 87.7% loss-maker rate shows that the profitability problem among active individual derivatives traders remains severe.
The evidence therefore supports a mixed assessment:
- fewer individuals participated;
- aggregate losses fell;
- new participation slowed;
- nearly nine in ten individuals in the profitability sample still lost money;
- average losses per trader increased; and
- losses remained concentrated among heavy and options-focused traders.
Does the study prove SEBI’s reforms succeeded?
Not completely.
If success is measured as reducing participation and aggregate individual loss exposure, the FY26 data moved in that direction.
If success means making active individual F&O traders broadly profitable, the data clearly do not show that.
A stronger assessment will require additional years of data showing whether loss incidence, trading intensity and concentrated speculative activity continue declining.
What should individual investors take from the study?
The studies are historical population-level evidence. They do not predict whether a particular future trade will make or lose money.
But several findings are difficult to ignore:
- Loss-making remains the dominant outcome among individual F&O traders.
- Options account for most aggregate individual losses.
- Very frequent traders account for a disproportionate share of losses.
- Repeated participation has not produced consistent profitability for most long-term cohorts.
- Large derivatives turnover relative to an individual’s financial base can create substantial exposure.
Anyone using derivatives should therefore distinguish hedging and disciplined risk management from repeated speculative exposure merely because an option premium appears inexpensive.
What the 87.7% figure does not mean
- It does not mean 87.7% of all Indian investors lost money.
- It does not mean every derivatives trade generates a loss.
- It does not mean every options strategy has identical risk.
- It does not prove institutions directly caused retail losses.
- It does not prove every trader who exited did so because of SEBI’s reforms.
- It does not establish that futures are safe.
- It does not guarantee that future F&O outcomes will match FY26.
Related SEBI investor guides from ThePulseSignal
- SEBI PaRRVA Explained: How Verified Return Claims Work and What Investors Should Check
- SEBI PaRRVA Deadline: Who Must Enrol and What Happens After the Last Date
- SEBI Demat Mutual Fund SWP-STP Rules: Can Investors Use the Facility Now?
- SEBI Digital Accessibility Deadline Extended: New Date and Who Must Comply
- Documents Required to Transfer Shares After Death: SEBI’s New 2026 Rules Explained
Official sources
- SEBI — Profitability of Individual Traders in the Equity Derivatives Segment, FY25-FY26
- SEBI — Trading Behaviour of Individual Traders in the Equity Derivatives Segment, FY25-FY26
- SEBI — Press release on retail derivatives participation, behaviour and profitability
How this article was verified
ThePulseSignal reviewed SEBI’s August 20, 2026 press release and the regulator’s separate FY25-FY26 studies on individual trader profitability and trading behaviour.
Special care was taken not to merge trader populations from the two studies. The 87.7% loss-maker statistic, aggregate profitability figures and broader active-participation figures are described within their respective study context.
ThePulseSignal also distinguishes observed FY26 changes from causal claims about SEBI’s interventions. A change occurring after a regulatory measure does not by itself prove that regulation was the sole cause.
Last verified: August 21, 2026.
Limitations and unresolved points
- The studies report aggregate and cohort-level outcomes and cannot predict whether a particular trader or strategy will make or lose money.
- Different parts of SEBI’s research use different datasets, samples and definitions, so similar trader-count figures should not be substituted for one another.
- Market conditions, volatility, trader composition, costs and regulatory rules can all influence year-to-year profitability.
- Institutional gross profits and individual net losses are different measures and should not be mechanically compared as a direct transfer.
Frequently asked questions
What percentage of individual F&O traders lost money in FY26?
SEBI’s FY26 profitability study found that 87.7% of individual traders in its equity-derivatives sample incurred net losses.
How much did individual F&O traders lose in FY26?
Aggregate net losses in SEBI’s profitability analysis were approximately ₹91,685 crore in FY26, down from about ₹1.12 lakh crore in FY25.
Did average individual losses also fall?
No. Despite lower aggregate losses, the average net loss per individual trader increased to approximately ₹1.17 lakh in FY26.
Were most individual F&O losses from options?
Yes. Options accounted for approximately 92% of aggregate individual derivatives losses in SEBI’s findings.
Did SEBI’s F&O measures stop retail traders from losing money?
No. Participation and aggregate losses declined, but 87.7% of individuals in the profitability study still incurred losses. The data therefore show reduced aggregate exposure rather than broad trader profitability.
Does trading F&O for more years make most people profitable?
SEBI’s multi-year cohort findings do not show broad movement toward consistent profitability merely from continuing to trade. In one five-year cohort, 65.6% lost money in every year and only about 0.5% were profitable in every year.
Are futures safe because options caused most losses?
No. Futures involve leverage and can also generate substantial losses. A lower loss-maker rate in one study does not make futures inherently safe.
Is this investment advice?
No. This article explains SEBI’s published research and regulatory context. It does not recommend taking or avoiding a particular securities position.