







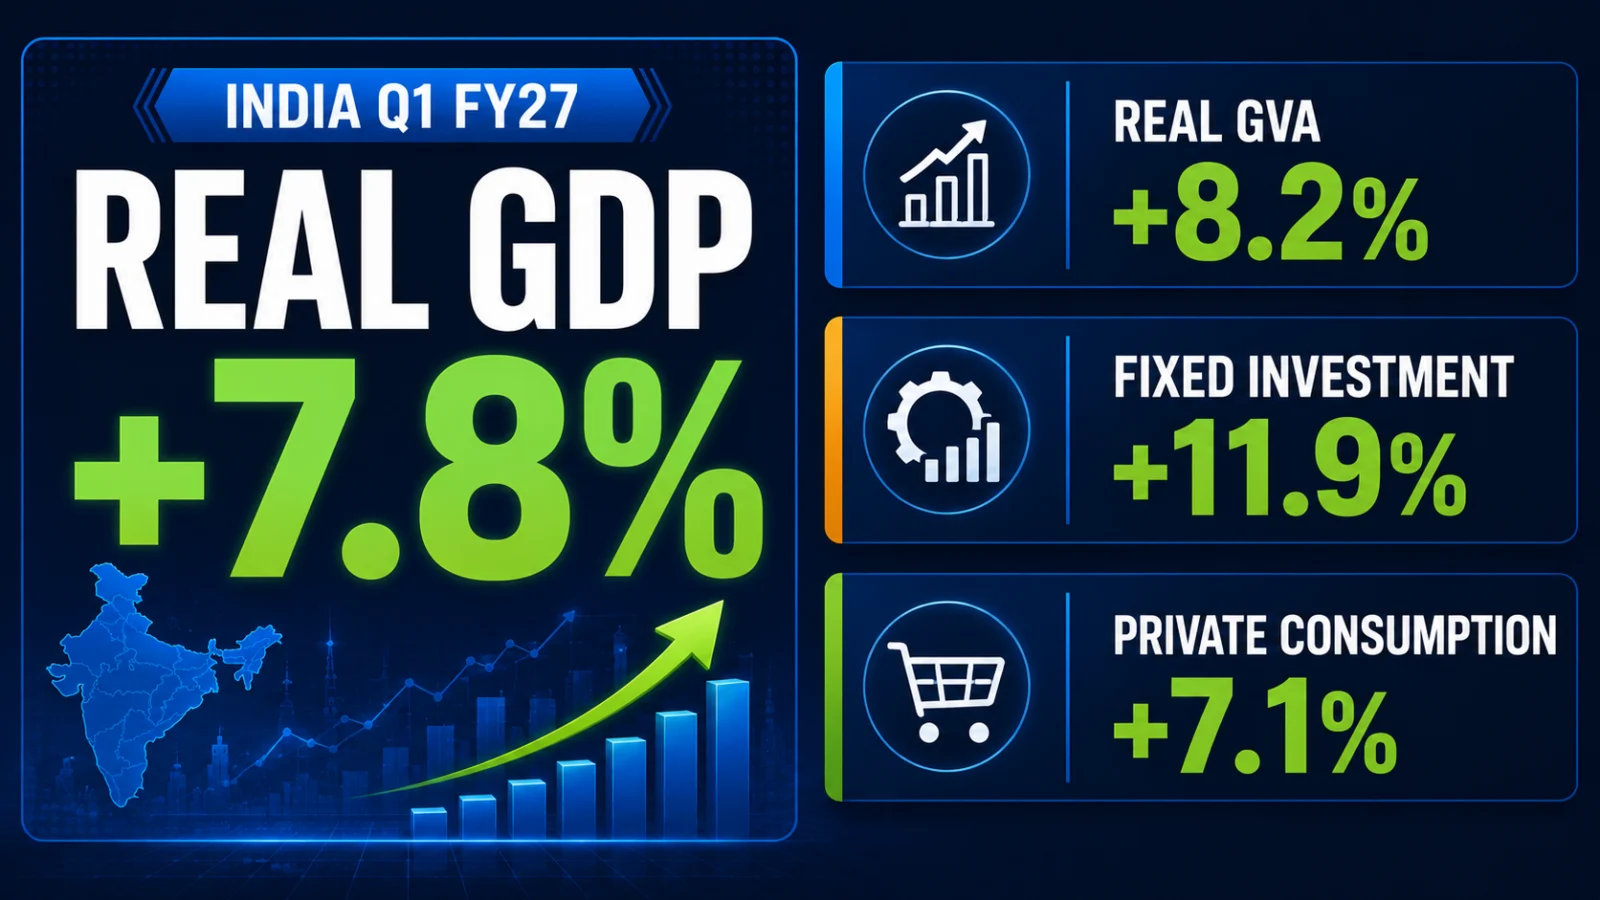
India Q1 FY27 GDP growth reached 7.8% year on year in April-June 2026, according to the official first quarterly estimates. That was above the Reserve Bank of India’s 7.0% Q1 projection. The headline is important, but the more useful question is what produced the growth: fixed investment was the standout expenditure component, while services and manufacturing provided strong production-side support.
Direct answer: India’s 7.8% real GDP growth was not driven by one number alone. Gross fixed capital formation rose 11.9%, private consumption rose 7.1%, manufacturing expanded 9.2%, and the broader services sector grew 10.0%. Real GVA grew even faster at 8.2%. Together, the figures point to strong investment and service-sector momentum, but they do not mean every household’s income rose 7.8% or that RBI policy must automatically change.
What exactly grew 7.8%?
The 7.8% figure refers to India’s real gross domestic product at constant 2022-23 prices for the first quarter of FY2026-27 compared with the same quarter a year earlier. Real GDP was estimated at ₹81.36 lakh crore. At current prices, or nominal terms, GDP was estimated at ₹88.27 lakh crore, representing nominal growth of 10.3%.
This distinction matters because real GDP removes the effect of price changes and is the figure normally used to discuss inflation-adjusted economic growth. Nominal GDP includes current prices and therefore grows through a combination of real activity and price changes.
How large was the surprise?
The official 7.8% result was 0.8 percentage point above the RBI’s 7.0% Q1 projection. That makes the release stronger than the central bank’s earlier quarterly assumption, but it should not be treated as proof that the full-year economy will necessarily outperform by the same margin. One quarter can be affected by base effects, the timing of investment and government activity, sector-specific strength and later revisions to source data.
The clearest demand-side signal: investment grew faster than consumption
The expenditure data show an important distinction that can get lost in headline coverage. Gross fixed capital formation rose 11.9%, while private final consumption expenditure rose 7.1%.
| Q1 FY27 indicator | Year-on-year growth | What it indicates |
|---|---|---|
| Real GDP | 7.8% | Overall inflation-adjusted economic output |
| Real GVA | 8.2% | Value added by producing sectors before net product taxes |
| Gross fixed capital formation | 11.9% | Strong fixed-investment activity |
| Private consumption | 7.1% | Continued household-consumption support |
That makes fixed investment the standout major expenditure component in the release. It would still be too strong to describe the entire 11.9% increase as a private corporate capex boom: aggregate fixed capital formation includes investment across more than one part of the economy.
Which sectors supplied the production-side strength?
The production data show strong contributions from both industry and services. Manufacturing grew 9.2%, while the broad tertiary or services sector expanded 10.0%. Within services, the financial, real-estate, information-technology and professional-services grouping grew 12.1%.
The strength was not uniform across every part of the economy. Agriculture and allied activity grew 3.6%, while the broader primary-sector GVA increase was about 2.9%. The result is therefore better described as strong overall growth with particularly strong investment, manufacturing and services rather than an identical acceleration across all sectors.
Why is GVA growth 8.2% when GDP growth is 7.8%?
GDP and GVA measure related but different things. GVA measures the value added by producing sectors. GDP is derived by adding taxes on products and subtracting subsidies on products from GVA. Because those net-product-tax components can grow at a different rate from underlying sectoral value added, GDP and GVA growth do not have to be identical in the same quarter.
For Q1 FY27, real GVA grew 8.2%, faster than the 7.8% real GDP rate. That is not a contradiction; it follows from the different accounting definitions.
Why did MoSPI issue extra clarification after the GDP release?
On September 2, the Ministry of Statistics and Programme Implementation published additional information specifically addressing questions raised about the updated national-accounts series. The clarification covers the use of double deflation, negative implicit deflators in some components, differences between CPI, WPI and producer-price measures, the gap between nominal and real GDP or GVA, discrepancies between production-side and expenditure-side estimates, and comparisons between the old and new series.
The clarification does not replace the 7.8% Q1 FY27 estimate. Instead, it explains why real growth rates can move differently from nominal growth and why simple comparisons using different price indices or statistical series can produce misleading conclusions.
What changed in the GDP methodology?
India’s current national-accounts series uses 2022-23 as the base year. MoSPI says the updated estimates incorporate newly available data, including the new Producer Price Index and revised Index of Industrial Production inputs where appropriate.
MoSPI says Producer Price Index data are conceptually closer to the prices received by domestic producers than the Wholesale Price Index that had previously been used as a proxy in relevant components. The ministry also says PPI is not applied universally: the price indicator used depends on the economic activity being measured.
The ministry’s FAQ makes another important point: adopting PPI does not automatically raise GDP growth. Depending on the sector, period and difference between the old and new price indicators, revised growth rates can move either upward or downward.
What is double deflation, and why does it matter?
For some producing sectors, statistical agencies estimate real value added by separately removing price changes from output and intermediate inputs. This is known as double deflation.
Because output prices and input prices do not always move together, the resulting real-value-added measure can behave differently from a simple deflation of one nominal total. That is one reason a sector can show an unusual implicit deflator or why real and nominal growth rates can differ more than readers expect.
A negative implicit deflator in a particular component therefore should not automatically be read as evidence that the entire economy experienced falling consumer prices. It is an accounting result derived from the relevant nominal and real series and must be interpreted within the underlying sector and methodology.
Can the old GDP series be directly compared with the new series?
Only with care. MoSPI says the updated series incorporates new price and volume indicators and revised administrative data. Historical annual and quarterly estimates from FY2022-23 onward have therefore been revised wherever those inputs apply.
This means a calculation that mixes an old-series GDP level with a new-series GDP level can produce a misleading growth rate. Readers comparing older commentary, projections or historical GDP values should first confirm that both numbers come from a consistent statistical series.
Does 7.8% mean household incomes rose 7.8%?
No. GDP is an aggregate measure of economic production. It does not show how income gains are distributed between households, firms, regions or industries. A quarter can record strong national GDP growth while some households or sectors experience much weaker income growth.
The same caution applies to wages, employment and living standards. Those questions require labour-market, income, inflation and distributional evidence in addition to GDP.
Does this GDP beat decide what RBI will do next?
No. The stronger-than-projected growth print becomes part of the information available to the Reserve Bank of India, but monetary-policy decisions also depend on inflation, inflation forecasts, liquidity, financial conditions, external risks and the broader growth outlook. The Q1 release therefore should not be converted into an automatic rate-hike or rate-cut prediction.
Can the Q1 number change later?
Yes. Quarterly GDP estimates are constructed from the best source data available at the time and can later be revised as additional or updated information becomes available. The 7.8% figure is the controlling current estimate, not a promise that every underlying component will remain unchanged in later national-accounts releases.
MoSPI says incorporation of the new PPI, IIP and administrative inputs affected both annual and quarterly estimates from FY2022-23 onward where relevant. The size and direction of revisions can differ by sector and period.
What the 7.8% number supports — and what it does not
- Confirmed: real GDP grew 7.8%, real GVA 8.2%, fixed investment 11.9% and private consumption 7.1% in Q1 FY27.
- Confirmed: manufacturing and services were among the stronger production-side contributors.
- Confirmed: the current estimates use the 2022-23-base-year series and incorporate updated price, production and administrative inputs.
- Reasonable interpretation: investment strength was a more prominent demand-side feature than the headline alone shows.
- Not established: that every household became 7.8% better off.
- Not established: that the full 11.9% fixed-investment increase was private corporate investment.
- Not established: that RBI must change interest rates because of this one release.
- Not valid: deriving a growth rate by mixing incompatible old-series and new-series GDP levels without first reconciling the methodology.
What happens next?
The next test is whether the strength seen in Q1 persists through later activity, inflation and investment data. RBI commentary or a material forecast revision would add policy context, while the next quarterly GDP estimate will show whether Q1’s momentum continued into July-September.
How this was verified
ThePulseSignal reviewed the official MoSPI/NSO Q1 FY27 GDP release for the headline GDP, GVA, expenditure and sector figures, and the ministry’s September 2 follow-up clarification on the updated GDP methodology. The review also checked MoSPI’s current FAQ explaining the use of PPI, revised IIP inputs, quarterly revisions and old-versus-new-series comparisons. The analysis separates official statistical facts from interpretation and does not treat one quarterly estimate as proof of household-income growth, full-year performance or a predetermined RBI decision.
Limitations and unresolved facts
- Q1 FY27 GDP and component estimates can still be revised in later national-accounts releases.
- The persistence of the 11.9% fixed-investment growth rate into later quarters is not established.
- The aggregate GFCF figure does not by itself identify how much of the increase came from private corporate investment versus other sectors.
- GDP does not establish household-level income, employment or distributional outcomes.
- The Q1 release alone does not determine future RBI policy.
- Comparisons with older GDP estimates require consistent series and methodology; old-series and new-series levels should not be mixed mechanically.